
The many Vizlib extensions are available in the following packages:
The many Vizlib extensions are available in the following packages:
Vizlib extensions are available in the following packages:
Vizlib Library is by far the most powerful product for Qlik Sense visual analytics. It allows users to redefine Qlik's native functions without a single line of code.
With access to more than 20 individual charts, users can develop intuitive, interactive applications for any use case and achieve solutions that would otherwise be impossible.
Fully customisable, supported and packed with advanced out-of-the-box features.
Use advanced analytics, research details in Viztips, define shortcuts via actions and automate workflows.
Pie Chart
Vizlib Library | Essential Charts
Pie Chart
Vizlib Library | Essential Charts
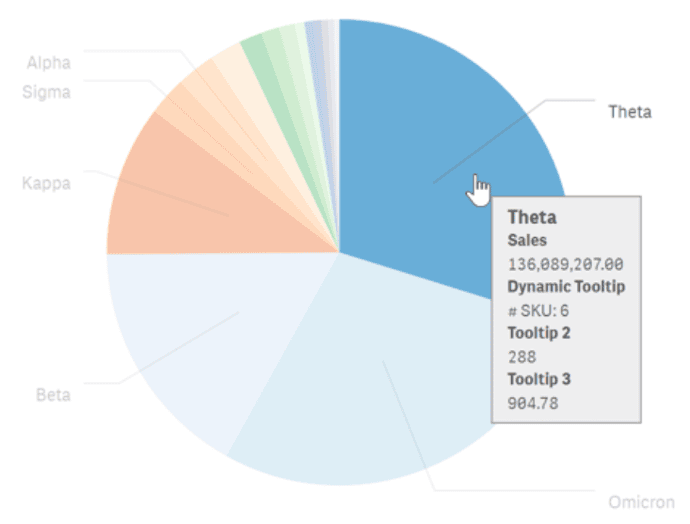
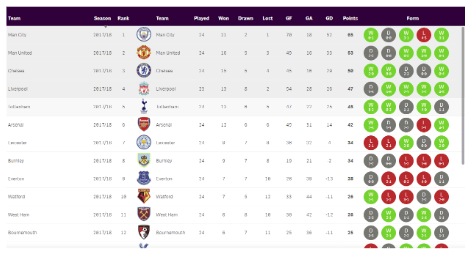
The Vizlib Pie Chart is a highly customisable, supported and easy-to-use extension for Qlik Sense. The wide range of design and layout options available with Vizlib Pie Chart means you can focus on creating compelling visualisations and dashboards without writing a single line of code.
Pie Chart
Vizlib Library | Essential Charts
Pie Chart
Vizlib Library | Essential Charts
The Vizlib Pie Chart is a highly customisable, supported and easy-to-use extension for Qlik Sense. The wide range of design and layout options available with Vizlib Pie Chart means you can focus on creating compelling visualisations and dashboards without writing a single line of code.
Bar Chart
Vizlib Library | Essential Charts
Bar Chart
Vizlib Library | Essential Charts
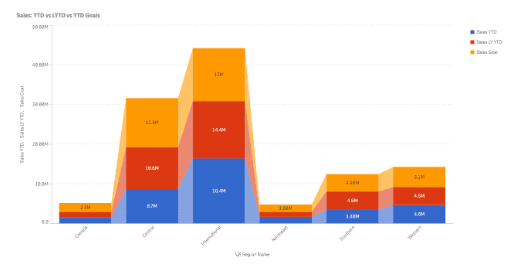
Vizlib Bar Chart is a highly customisable, supported and easy-to-use extension for Qlik Sense that provides features such as grouped bars, stacked bars and overlapping bars to better compare and visualise quantitative data across a range of dimensions.
It supports either two dimensions and one measure or one dimension and multiple measures. Thus, the Vizlib Bar Chart is the ideal extension to create compelling dashboards and charts based on your own data.
In addition, Vizlib Bar Chart extends the standard features of Qlik Sense so you can focus on creating compelling visualisations and dashboards without having to write a single line of JavaScript code.
Bar Chart
Vizlib Library | Essential Charts
Bar Chart
Vizlib Library | Essential Charts
Vizlib Bar Chart is a highly customisable, supported and easy-to-use extension for Qlik Sense that provides features such as grouped bars, stacked bars and overlapping bars to better compare and visualise quantitative data across a range of dimensions.
It supports either two dimensions and one measure or one dimension and multiple measures. Thus, the Vizlib Bar Chart is the ideal extension to create compelling dashboards and charts based on your own data.
In addition, Vizlib Bar Chart extends the standard features of Qlik Sense so you can focus on creating compelling visualisations and dashboards without having to write a single line of JavaScript code.
Scatter Plot
Vizlib Library | Essential Charts
Scatter Plot
Vizlib Library | Essential Charts
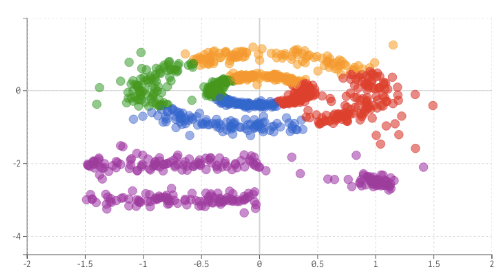
Shows the relationship between two quantitative measures for different categories and a third data dimension with size and colour for the data points.
Cluster data points, add reference objects for more context, support number abbreviations, format negative values and zoom.
Scatter Plot
Vizlib Library | Essential Charts
Scatter Plot
Vizlib Library | Essential Charts
Shows the relationship between two quantitative measures for different categories and a third data dimension with size and colour for the data points.
Cluster data points, add reference objects for more context, support number abbreviations, format negative values and zoom.
Line Chart
Vizlib Library | Essential Charts
Line Chart
Vizlib Library | Essential Charts
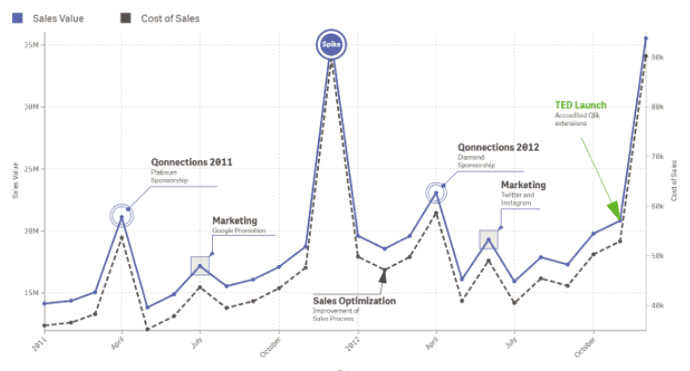
Vizlib Line Chart is a highly flexible, supported and easy-to-use extension for Qlik Sense that gives you almost unlimited design customisation options.
You can use it to focus on what you do best - creating compelling visualisations and dashboards without having to write a single line of code, and going far beyond the standard features of the native Qlik Sense object.
- Fully customisable multi-line chart with extensive formatting options.
- Choose between line or area chart and determine the interpolation method (linear/stepwise/cubic etc.).
- Wide range of data point representations, from symbols to images.
- Divide the sums by a second dimension represented by a pie chart or donut chart.
- Full support for interactivity and the ability to turn off native features.
- Option to accumulate the metric values on the x-axis.
- Add trend and regression lines.
Line Chart
Vizlib Library | Essential Charts
Line Chart
Vizlib Library | Essential Charts
Vizlib Line Chart is a highly flexible, supported and easy-to-use extension for Qlik Sense that gives you almost unlimited design customisation options.
You can use it to focus on what you do best - creating compelling visualisations and dashboards without having to write a single line of code, and going far beyond the standard features of the native Qlik Sense object.
- Fully customisable multi-line chart with extensive formatting options.
- Choose between line or area chart and determine the interpolation method (linear/stepwise/cubic etc.).
- Wide range of data point representations, from symbols to images.
- Divide the sums by a second dimension represented by a pie chart or donut chart.
- Full support for interactivity and the ability to turn off native features.
- Option to accumulate the metric values on the x-axis.
- Add trend and regression lines.
Combo Chart
Vizlib Library | Essential Charts
Combo Chart
Vizlib Library | Essential Charts
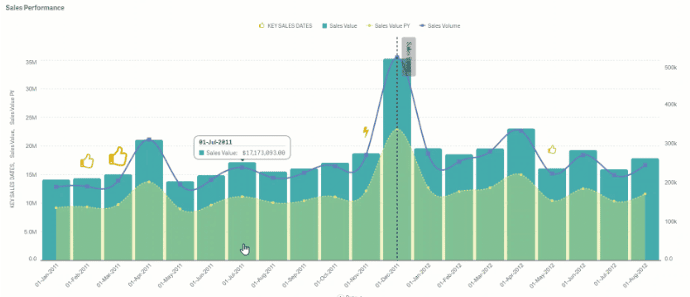
Combines the functions of the Vizlib bar chart and line chart to gain more meaningful insights.
Add a benchmark, reference lines and interactivity. Control formatting, display, line or bar display and add markers or symbols.
Combo Chart
Vizlib Library | Essential Charts
Combo Chart
Vizlib Library | Essential Charts
Combines the functions of the Vizlib bar chart and line chart to gain more meaningful insights.
Add a benchmark, reference lines and interactivity. Control formatting, display, line or bar display and add markers or symbols.
Grid Chart
Vizlib Library | Essential Charts
Grid Chart
Vizlib Library | Essential Charts
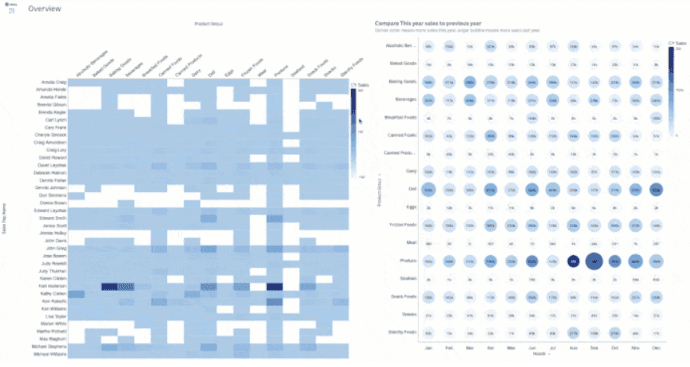
The Vizlib Grid Chart is a highly customisable, supported and easy-to-use extension for Qlik Sense that provides a graphical representation of your data, similar to a heatmap chart. Individual values are contained in a matrix and are highlighted based on your measurement.
Grid Chart
Vizlib Library | Essential Charts
Grid Chart
Vizlib Library | Essential Charts
The Vizlib Grid Chart is a highly customisable, supported and easy-to-use extension for Qlik Sense that provides a graphical representation of your data, similar to a heatmap chart. Individual values are contained in a matrix and are highlighted based on your measurement.
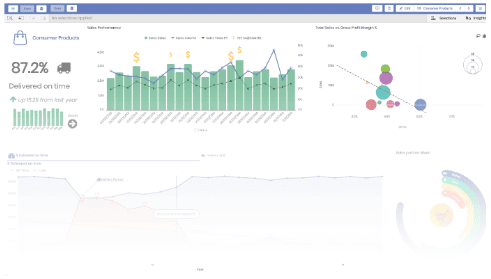
KPI Designer
Vizlib Library | Advanced Charts
KPI Designer
Vizlib Library | Advanced Charts
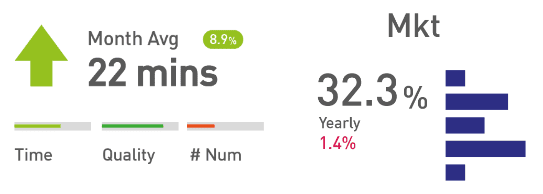
Visualises KPI performance and offers the possibility of overlaying and supports the creation of KPI objects.
Combine Vizlib KPI Designer with Viztips to add customised, dynamic charts in tooltips.
Create 11 custom layers to create KPI objects, support for multiple actions at layer level or as a global setting, presets to speed up the design process, pixel-perfect positioning of layers and Responsive Design.
KPI Designer
Vizlib Library | Advanced Charts
KPI Designer
Vizlib Library | Advanced Charts
Visualises KPI performance and offers the possibility of overlaying and supports the creation of KPI objects.
Combine Vizlib KPI Designer with Viztips to add customised, dynamic charts in tooltips.
Create 11 custom layers to create KPI objects, support for multiple actions at layer level or as a global setting, presets to speed up the design process, pixel-perfect positioning of layers and Responsive Design.
Sankey Chart
Vizlib Library | Advanced Charts
Sankey Chart
Vizlib Library | Advanced Charts
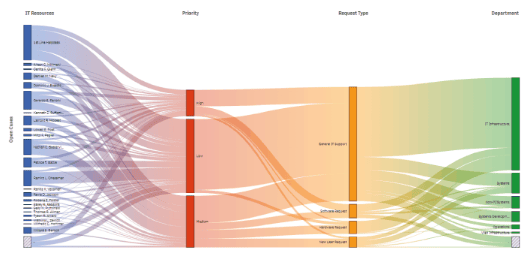
Creation and visualisation of data flows and splits. The chart is easy and intuitive to use and provides an overview or the possibility to go into details.
Flexible sizing, user-friendly functionality and customisation, transitions between selection levels, interactivity modes such as zooming and rearranging dimensions, conditionally showing and hiding dimensions.
Sankey Chart
Vizlib Library | Advanced Charts
Sankey Chart
Vizlib Library | Advanced Charts
Creation and visualisation of data flows and splits. The chart is easy and intuitive to use and provides an overview or the possibility to go into details.
Flexible sizing, user-friendly functionality and customisation, transitions between selection levels, interactivity modes such as zooming and rearranging dimensions, conditionally showing and hiding dimensions.
Active Gauge
Vizlib Library | Advanced Charts
Active Gauge
Vizlib Library | Advanced Charts
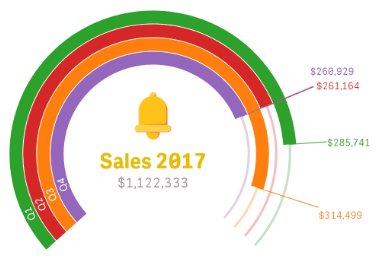
Compare multiple quantitative measures or a quantitative measure divided by category. Examine the relative performance of categories for direct visual comparison in radial bars.
You can display 1 dimension and 1 measurement or up to 10 different measurements. Full customisation of arc width, corner rounding and distance, selection either in the chart or in the legend.
Active Gauge
Vizlib Library | Advanced Charts
Active Gauge
Vizlib Library | Advanced Charts
Compare multiple quantitative measures or a quantitative measure divided by category. Examine the relative performance of categories for direct visual comparison in radial bars.
You can display 1 dimension and 1 measurement or up to 10 different measurements. Full customisation of arc width, corner rounding and distance, selection either in the chart or in the legend.
Heatmap
Vizlib Library | Advanced Charts
Heatmap
Vizlib Library | Advanced Charts
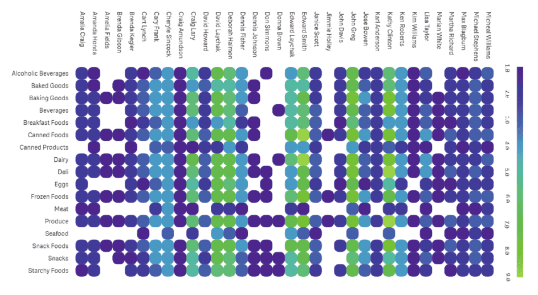
Display individual values as colours based on a specific measure. Analyse large, complex data sets and interpret findings with the colour-coded format.
User-defined colour palettes, improved tooltips, intelligent positioning of the legend, configurable reference lines.
Heatmap
Vizlib Library | Advanced Charts
Heatmap
Vizlib Library | Advanced Charts
Display individual values as colours based on a specific measure. Analyse large, complex data sets and interpret findings with the colour-coded format.
User-defined colour palettes, improved tooltips, intelligent positioning of the legend, configurable reference lines.
Venn Chart
Vizlib Library | Advanced Charts
Venn Chart
Vizlib Library | Advanced Charts
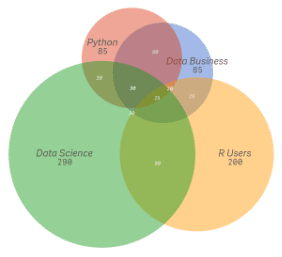
Drag and drop available dimensions and measures to create visual representations of the relationships between data. Identify the logical relationships between data sets.
Automatic display based on data selection, labelling, colour and circle formatting.
Venn Chart
Vizlib Library | Advanced Charts
Venn Chart
Vizlib Library | Advanced Charts
Drag and drop available dimensions and measures to create visual representations of the relationships between data. Identify the logical relationships between data sets.
Automatic display based on data selection, labelling, colour and circle formatting.
Mekko Chart
Vizlib Library | Advanced Charts
Mekko Chart
Vizlib Library | Advanced Charts
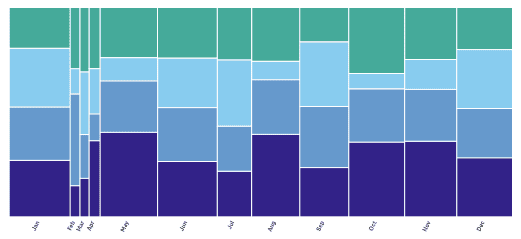
Visualisation and evaluation of the relationship between part and whole of two variables.
A variable-width stacked bar chart showing the relationships between two variables at once, conditional colours by expression.
Mekko Chart
Vizlib Library | Advanced Charts
Mekko Chart
Vizlib Library | Advanced Charts
Visualisation and evaluation of the relationship between part and whole of two variables.
A variable-width stacked bar chart showing the relationships between two variables at once, conditional colours by expression.
Story Timeline
Vizlib Library | Advanced Charts
Story Timeline
Vizlib Library | Advanced Charts
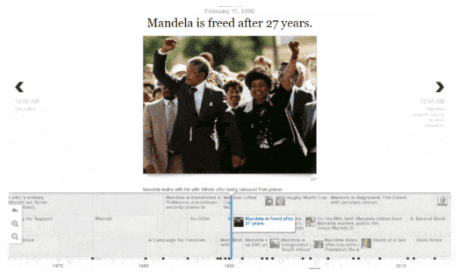
Create visual, media timelines in Qlik Sense to scroll through markers of events or milestones.
Supports multiple media types, displays project phases, visualises business interactions, e.g. relationships between clients and vendors.
Story Timeline
Vizlib Library | Advanced Charts
Story Timeline
Vizlib Library | Advanced Charts
Create visual, media timelines in Qlik Sense to scroll through markers of events or milestones.
Supports multiple media types, displays project phases, visualises business interactions, e.g. relationships between clients and vendors.
Waterfall Chart
Vizlib Library | Advanced Charts
Waterfall Chart
Vizlib Library | Advanced Charts
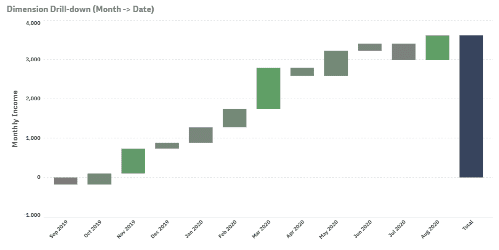
Identify the impact of a measure and illustrate how the totals change over time, e.g. inventory or customer churn.
Vertical or horizontal format, highly customisable, detailed root cause analysis.
Waterfall Chart
Vizlib Library | Advanced Charts
Waterfall Chart
Vizlib Library | Advanced Charts
Identify the impact of a measure and illustrate how the totals change over time, e.g. inventory or customer churn.
Vertical or horizontal format, highly customisable, detailed root cause analysis.
Ridgeline Plot
Vizlib Library | Advanced Charts
Ridgeline Plot
Vizlib Library | Advanced Charts
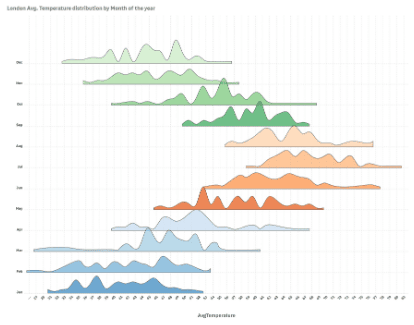
Gain insights into the seasonality of the data and changes over time. You also save valuable space on the dashboard.
Highly customisable, comparison of trends or distribution between multiple elements.
Ridgeline Plot
Vizlib Library | Advanced Charts
Ridgeline Plot
Vizlib Library | Advanced Charts
Gain insights into the seasonality of the data and changes over time. You also save valuable space on the dashboard.
Highly customisable, comparison of trends or distribution between multiple elements.
Table
Vizlib Library | Tables
Table
Vizlib Library | Tables
A highly customisable, supported extension for Qlik Sense that provides functionality to easily and quickly create tables for data, which can then be customised as the data evolves.
Horizontal scrolling in columns, full control over colour and alignment, sparkline charts/mini charts in each row, formatting of headers and support for dynamic labels.
Table
Vizlib Library | Tables
Table
Vizlib Library | Tables
A highly customisable, supported extension for Qlik Sense that provides functionality to easily and quickly create tables for data, which can then be customised as the data evolves.
Horizontal scrolling in columns, full control over colour and alignment, sparkline charts/mini charts in each row, formatting of headers and support for dynamic labels.
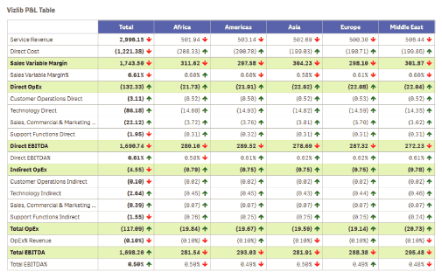
Pivot Table
Vizlib Library | Tables
Pivot Table
Vizlib Library | Tables
Summary of data and findings from extensive, detailed data sets.
Conditional showing and hiding of dimensions and ratios, indentation or fully expanded pivot styles, indicators for ratios to illustrate change or growth.
Pivot Table
Vizlib Library | Tables
Pivot Table
Vizlib Library | Tables
Summary of data and findings from extensive, detailed data sets.
Conditional showing and hiding of dimensions and ratios, indentation or fully expanded pivot styles, indicators for ratios to illustrate change or growth.
Container
Vizlib Library | Navigation Tools
Container
Vizlib Library | Navigation Tools
Provides more space on the dashboard by optimising the clarity of the charts and enabling a guided analysis concept.
Dynamic drill-down, grid mode, retention of filters and adjustments, conditional showing and hiding of charts, selection of preset designs, activation of charts based on conditions such as variable values or selections.
Container
Vizlib Library | Navigation Tools
Container
Vizlib Library | Navigation Tools
Provides more space on the dashboard by optimising the clarity of the charts and enabling a guided analysis concept.
Dynamic drill-down, grid mode, retention of filters and adjustments, conditional showing and hiding of charts, selection of preset designs, activation of charts based on conditions such as variable values or selections.
Navigation menu
Vizlib Library | Navigation Tools
Navigation menu
Vizlib Library | Navigation Tools
Provides more space on the dashboard by optimising the clarity of the charts and enabling a guided analysis concept.
Create a consistent and intuitive user experience by replicating the design of navigation bars in web applications to save time and improve visual consistency.
Navigation menu
Vizlib Library | Navigation Tools
Navigation menu
Vizlib Library | Navigation Tools
Provides more space on the dashboard by optimising the clarity of the charts and enabling a guided analysis concept.
Create a consistent and intuitive user experience by replicating the design of navigation bars in web applications to save time and improve visual consistency.
Text Object
Vizlib Library | UI Components
Text Object
Vizlib Library | UI Components
Table extension for Qlik Sense that supports advanced functionalities such as HTML code, tooltips and copying content to the clipboard when right-clicking.
Configurable tooltip, support for right-click copy function, support for multiple actions such as export data, selection in a field and apply bookmark.
Text Object
Vizlib Library | UI Components
Text Object
Vizlib Library | UI Components
Table extension for Qlik Sense that supports advanced functionalities such as HTML code, tooltips and copying content to the clipboard when right-clicking.
Configurable tooltip, support for right-click copy function, support for multiple actions such as export data, selection in a field and apply bookmark.
Slider
Vizlib Library | UI Components
Slider
Vizlib Library | UI Components
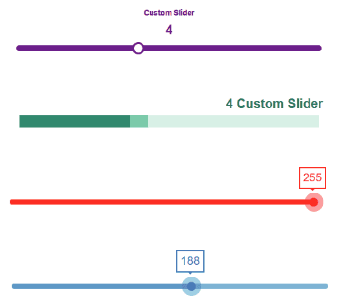
An all-in-one component that allows users to define and set variable values in a slider, providing enhanced control of the dashboard through slider actions.
Supports one or two variables, Vizlib actions and Vizlib templates. Predefined slider styles.
Slider
Vizlib Library | UI Components
Slider
Vizlib Library | UI Components
An all-in-one component that allows users to define and set variable values in a slider, providing enhanced control of the dashboard through slider actions.
Supports one or two variables, Vizlib actions and Vizlib templates. Predefined slider styles.
Calendar
Vizlib Library | UI Components
Calendar
Vizlib Library | UI Components
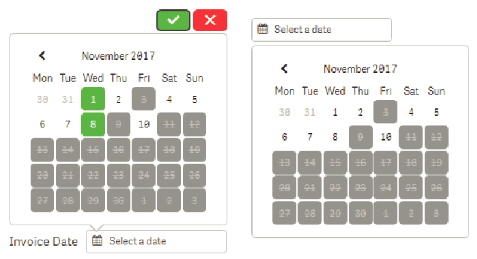
Visual planning and analysis tool that highlights dates or displays a reading next to the date, automatic recognition of dates, date ranges, font and size control, custom colours and predefined selections.
Highlight specific dates, display a KPI next to the date, save time with the wizard, select a single date or date range, zoom in or out to save space.
Calendar
Vizlib Library | UI Components
Calendar
Vizlib Library | UI Components
Visual planning and analysis tool that highlights dates or displays a reading next to the date, automatic recognition of dates, date ranges, font and size control, custom colours and predefined selections.
Highlight specific dates, display a KPI next to the date, save time with the wizard, select a single date or date range, zoom in or out to save space.
Filter
Vizlib Library | UI Components
Filter
Vizlib Library | UI Components
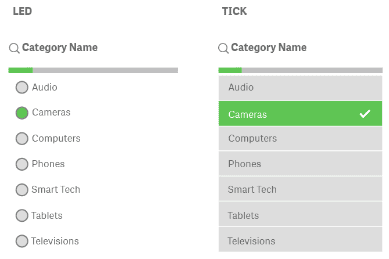
Filter component for Qlik Sense that optimises selection in the data model through powerful search. Advanced features include custom styling options and support for Vizlib templates and actions.
Support for listbox, button and dropdown components, an option for selected values or default selections, right-click copy support, conditional show/hide of filter values.
Filter
Vizlib Library | UI Components
Filter
Vizlib Library | UI Components
Filter component for Qlik Sense that optimises selection in the data model through powerful search. Advanced features include custom styling options and support for Vizlib templates and actions.
Support for listbox, button and dropdown components, an option for selected values or default selections, right-click copy support, conditional show/hide of filter values.
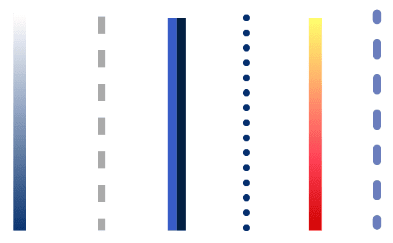
Line object
Vizlib Library | UI Components
Line object
Vizlib Library | UI Components
Layout and organisation of the dashboard. Style and colour can be selected according to the theme of the dashboard, as well as alignment and orientation.
Flexible positioning, choice of orientation, interactivity.
Line object
Vizlib Library | UI Components
Line object
Vizlib Library | UI Components
Layout and organisation of the dashboard. Style and colour can be selected according to the theme of the dashboard, as well as alignment and orientation.
Flexible positioning, choice of orientation, interactivity.
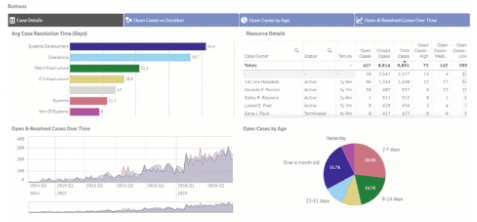
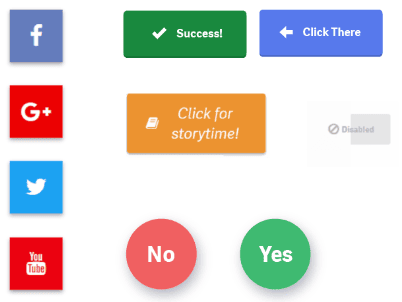
Buttons
Vizlib Library | UI Components
Buttons
Vizlib Library | UI Components
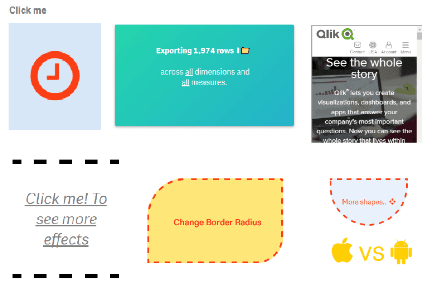
Provides guided analysis that allows users to create shortcuts, navigate the app and gain insights. It simplifies and speeds up the flow of data between apps.
API integration, support for multiple buttons, individual control of colours, labels and icons, manual or automatic resizing.
Buttons
Vizlib Library | UI Components
Buttons
Vizlib Library | UI Components
Provides guided analysis that allows users to create shortcuts, navigate the app and gain insights. It simplifies and speeds up the flow of data between apps.
API integration, support for multiple buttons, individual control of colours, labels and icons, manual or automatic resizing.
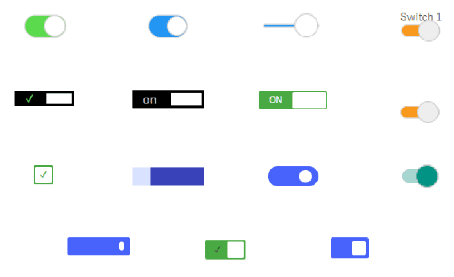
Switch
Vizlib Library | UI Components
Switch
Vizlib Library | UI Components
Customise and control charts and dashboards. Turn measures, dimensions or colours on and off, or switch between charts in the container grid. Combine these UX functions with visualisations to facilitate access to functions and settings and improve the user experience.
Switch dimensions or define measures, change charts or dashboard views, update KPI sets, themes or accessibility settings, insert check boxes for easy-to-use checks and controls, basic on/off functions for easy data analysis.
Switch
Vizlib Library | UI Components
Switch
Vizlib Library | UI Components
Customise and control charts and dashboards. Turn measures, dimensions or colours on and off, or switch between charts in the container grid. Combine these UX functions with visualisations to facilitate access to functions and settings and improve the user experience.
Switch dimensions or define measures, change charts or dashboard views, update KPI sets, themes or accessibility settings, insert check boxes for easy-to-use checks and controls, basic on/off functions for easy data analysis.

AMP
AMP
The AMP package provides you with Qlik Sense in addition to your existing QlikView licences. We will be happy to advise and assist you.

Consulting
Consulting
Our experienced consultants and project managers are happy to help you implement any QlikView projects you may have in mind.

Development
Development
You don't want to develop your QlikView dashboards and data models yourself? In that case, we'll be happy to do it for you.

Support
Support
If you have any problems or questions, our support team will help you quickly and easily. By phone, email or in a personal online call.

Training
Training
Our QlikView trainings are very hands-on oriented and we are one of the few qualified Qlik training partners. Simply because we love training.

Scaling
Scaling
Optimising your QlikView environment becomes simple and straightforward with our support. We fix performance issues.
We look forward to meeting you!
We look forward to meeting you!
Send us your contact details and we will contact you as soon as possible.
Or schedule a free online meeting with us:
Or call us right now: +49 40 60946300
Quotation and invoicing
Quotation and invoicing
If you need a quote for your company, you can tick it off directly in the contact form - we will send it to you promptly.
Your company can then order the training and pay by invoice. The only important thing is that the invoice is paid by the start of the training.
Other questions
Other questions
We are also happy to answer any questions you may have about the training content.
Maybe you would like a customised training or workshop based on your data?
We are very flexible - feel free to contact us.