For your optimal
For your optimal
Qlik View Entry
Qlik View Entry

Designer
Designer
Design dashboards
Learn how to design an optimal Qlik View user interface.

Data Architect
Data Architect
Create data models
Learn how to create optimal data models according to best practices.

Fast Track
Fast Track
Lightning fast and compact
A quick start on how to load and visualise data with Qlik View.

Qlik View
Qlik View
Designer
Designer
If you want to design dashboards and optimal analysis interfaces in QlikView, this is your training.
Even if you want to create data models, you should start with this training to know how your analysts design the user interface and work with QlikView.
We begin with basic operations and then create a new QlikView applicationfor a sales analysis.
Load the required data from an Excel spreadsheet and learn how to createa simple data model using the Script Editor.
Then you create several worksheets according to the best practices and learn about variables and Set Analysis.
This training is the ideal introduction to UI design with QlikView.
More about Qlik View
More about Qlik View
Designer
Designer
What you will learn in Qlik View Training
What you will learn in Qlik View Training
Quick starter
Quick starter

Navigation
In this training, we start with a demo application in which you learn how to navigate easily between the various worksheets.
You will learn how to open a ready-to-use application as an analyst and how to best use the many QlikViewfunctions.

Selections

Create a new application
To do this, you will create a completely new application, which you will then expand into a full analysis over the course of the training. You will learn about the different objects and how to use them in analysis.

Load data
Your new application must first be filled with data, which is the basis for your daily analysis.
You will get to know the QlikView Script Editor and the wizards that help you load the data. You will also learn how to create calculated fields and automatically transform the loaded data.

Search for values
Again, we will review this by doing small exercises and you will learn how to find information and immediately to see the relationship of the data to each other.

A good design
Before we start creating a new QlikView interface, you will learn the basics of good data visualisation.
We will look at how our brain processes information and how your data should therefore be presented. We then transfer these principles onto your new QlikView application.

Sales analysis
After the data is loaded, you start building the QlikViewinterface for sales analysis. You will create different worksheets and each one will use different charts or perhaps previously used charts but in a new variation.
With each worksheet, new things are added, so your knowledge is constantly expanded and you learn about different options.

Alternate States
The analysts often want to start unusual analyses and therefore need a lot of flexibility in the QlikViewapplication.
Using QlikView Alternate States, your analysts can compare any number of different data sets and contrast the results. You will get to know two variations that give your analysts all the possibilities to compare selections.

Set Analysis
One of the most important functionalities in QlikView is Set Analysis. There will hardly be a KPI in your company you can calculate without it. It ensures that you can create year-over-year comparisons or ask QlikView: Which customer bought product A, but never product B?
We will create a dynamic YoY comparison and a chart that only looks at the YTD period.

Variables
Next, you will learn about the use of variables in QlikView: What they can do, how to create them and how to use them in your analysis.
We will create a what-if analysis and you will learn how to show and hide objects and KPI's with them. To do this, you will create buttons and use them to show and hide objects.

QlikView Desktop
To create a new application you need the QlikViewDesktop. You will get to know it in detail in this training. You will learn how to use it and how to borrow a licence from QlikView Server. We will also look at the most important settings in your QlikView Desktop and the difference between the Personal Edition and the Desktop Edition.

Best Practices
After your analysis is done, let's talk about a very important point: What are the best practices for QlikView?

Qlik View
Qlik View
Data Architect
Data Architect
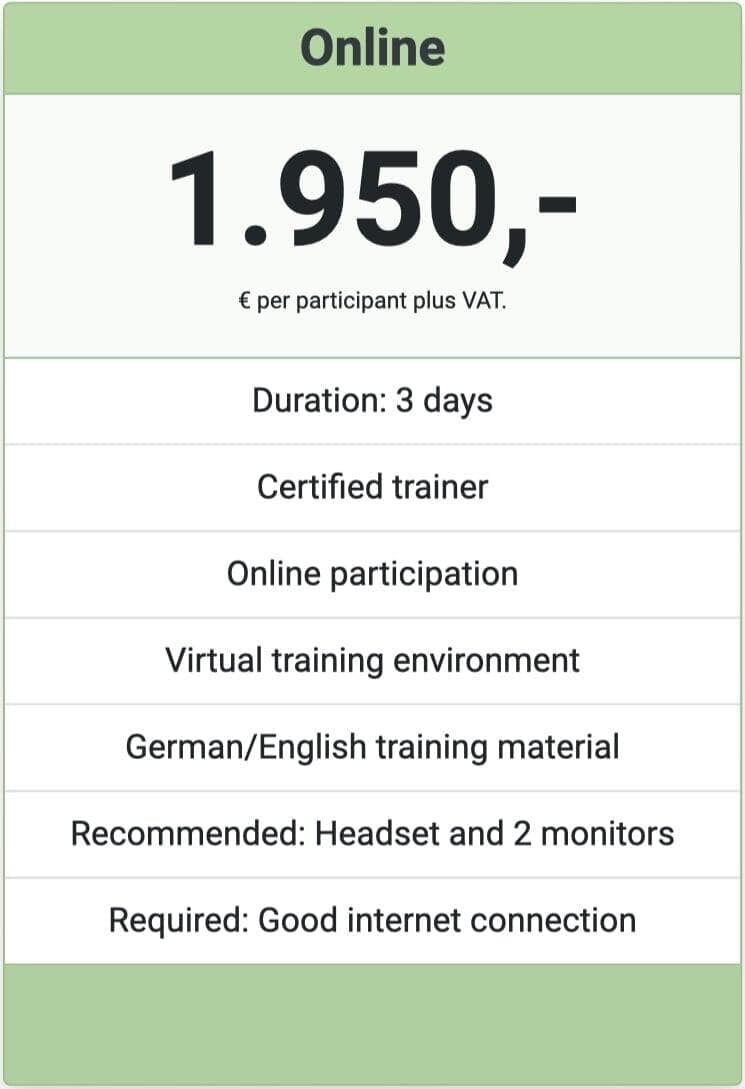
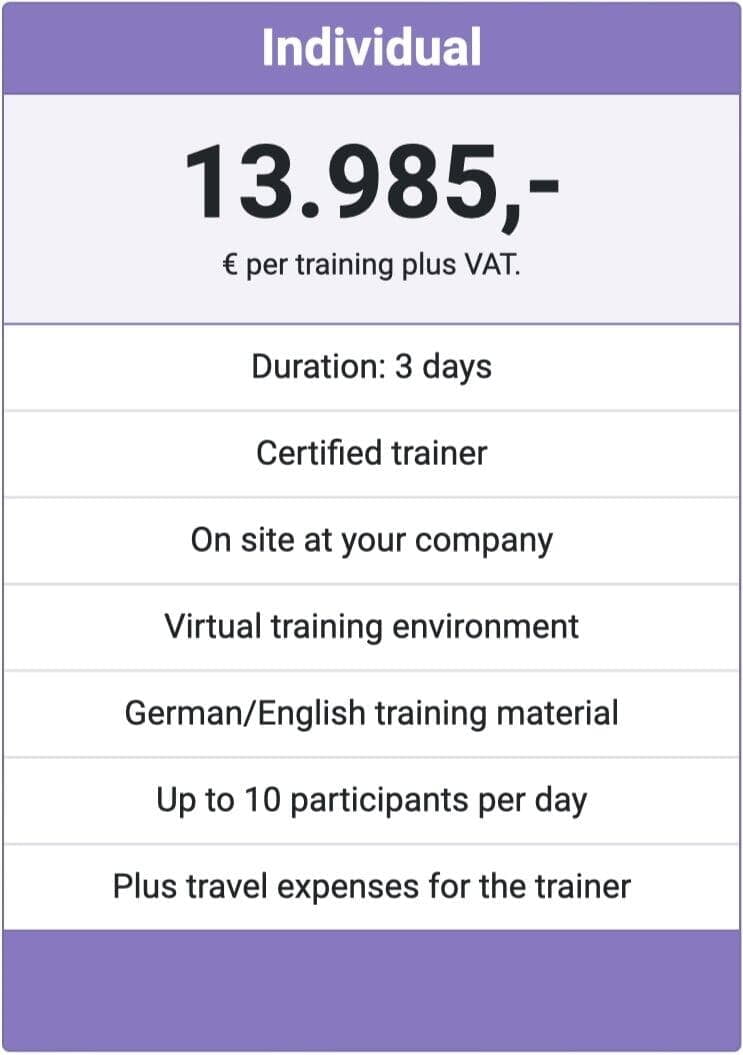
In this training you will learn how to quickly and easily model complex data models in QlikView using data from various data sources.
Databases, local files such as Excel and text files are all covered in this detailed training.
In many hands-on exercises you will try out all the techniques and learn in which situation you should use which technique. To achieve this, we contribute our experience from our QlikView customer projects over the last 14 years.
You will also learn the best practices for optimal performance and, of course, the permissions on the data which you will control with SectionAccess. This way you ensure that everyone only sees the data they are allowed to see.
Like the QlikView Designer training, this is based on a real-life scenario.
You have the task of creating a data model for a sales analysis and need to combine, transform and aggregate the data from very different systems and then make it available to the QlikView designers.
More about Qlik View
More about Qlik View
Data Architect Training
Data Architect Training
What you will learn in Qlik View Training
What you will learn in Qlik View Training
Data Architect
Data Architect

Basics
So everything you should consider right at the beginning of your project.

Script editor
You will get to know the Script Editor by creating your own script to load, transform and aggregate the data.

Synthetic Keys
As you load the first tables, fields and data into your new QlikView application, you quickly stumble across the Synthetic Keys. They're yuck and you'll learn why you should avoid them at all costs.
You learn about different methods to avoid Synthetic Keys and when exactly which method is the right one. This prevents your application from becoming slow and sluggish.

The table structure
Even if it seems so inconspicuous and simple, the TableStructure view is one of the most important tools in your QlikView application, because here you get an immense amount of important information about your data model's structure and the integrity of your data.
When a new table is loaded, the first thing we do is check the Data Model and you learn how to interpret the important information correctly.

Structure scripts
Who likes to work in an untidy workshop?
Probably nobody. You have to search for everything because nothing is where it belongs. Everything is all over the place.
This can happen to you quickly in a QlikView script, so you will learn how to structure and organise your scriptneatly.
To do this, you will learn about tabs and comments, which will help you to structure your script clearly.

Data sources
Whatever data you want to load into your application, you need a connection to the data source - you will learn about this in this training.
QlikView can tap into a lot of different data sourcesand load the data - for this, of course, QlikView must communicate correctly with the data source.
We will load data from a database and various files, including Excel, text and XML files.

Transform data
A very important technique when loading data is transformation. The data is almost never stored in the data source in the way it is needed for the analysis.
In addition, QlikView loads the data across systemsand in each system the data is stored differently again.
In this training you will learn the basic techniques of data transformation in QlikView and when to use which method.

Aggregate data
In addition to transformation, aggregation of data is sometimes an important tool.
Even though QlikView mostly does the aggregation of data on the surface, sometimes aggregation has to be done when the data is loaded.
You will learn which situations require aggregation and how you can best implement them in your QlikViewscript.
This includes the aggregation of data as well as the necessary pre-calculations of some KPIs.

Multilayer loading
Similar to a data warehouse (DWH), it makes sense to load data in multiple layers into QlikView.
There is a layer for extracting the data, a layer for transforming and aggregating it and then there is the distribution of the data to all QlikView applications.
This is to avoid erroneous data, duplicate calculationsand unnecessary loading times.
In this training you will learn the best practices and how to create an optimal data flow.
You will also learn about the QVD files that are at the core of this practice.

Optimum performance
A very important topic is the best practices for optimal performance in your QlikView applications - and as a Data Architect you can contribute a lot to this.
You learn what you should pay attention to and how you can avoid performance problems with optimal data models and loading processes.
Since QlikView uses in-memory technology, some things are different from what you might be used to with relational databases. We will go into these differences.

Developer workflows
Your application is ready - now what?
You will learn what a development workflow in QlikView can look like and how to publish applications to the Access Point.
If you pay attention to a few important things in the workflows, you can be sure there will be no problems in the production environment.
You will also learn how to further develop and then republish productive QlikView applications.

Section Access
Our last topic will be Section Access, which in practice is always implemented at the very end.
The Section Access controls, among other things, access to the application, but above all who is allowed to see which data in the QlikView application.
If not all analysts are allowed to see all data of the application, but only a part of it, depending on the user, this is exactly what Section Access controls.
You learn how Section Access works, how to plan it and how to integrate it into your data model.

Qlik View
Qlik View
Fast Track
Fast Track
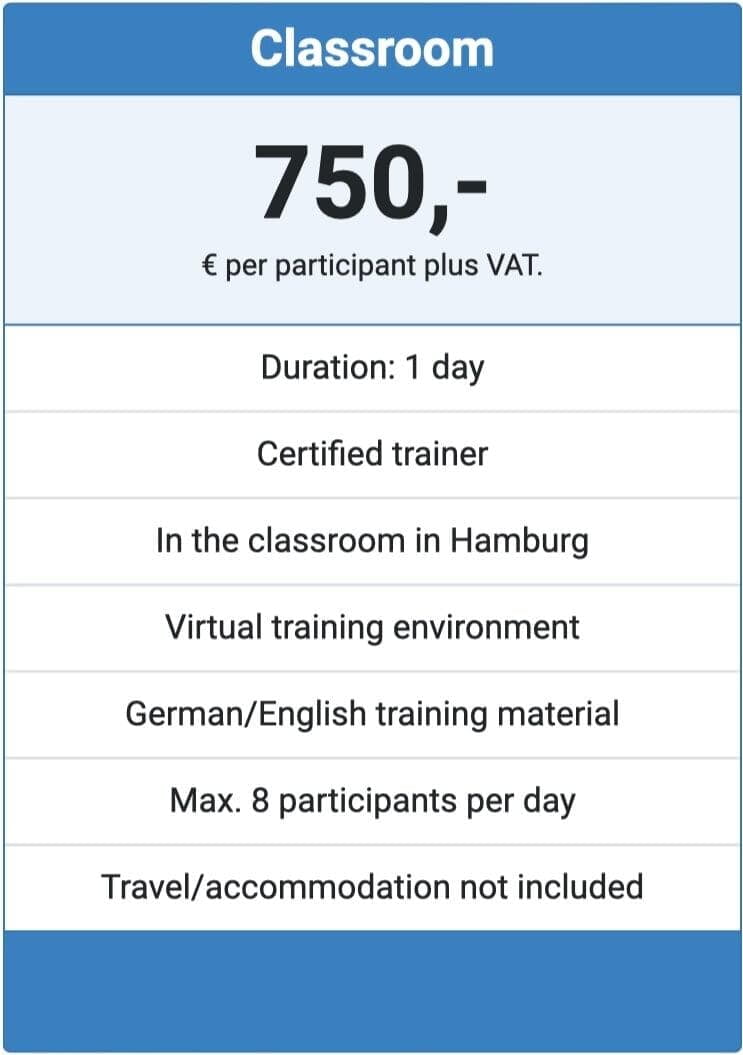
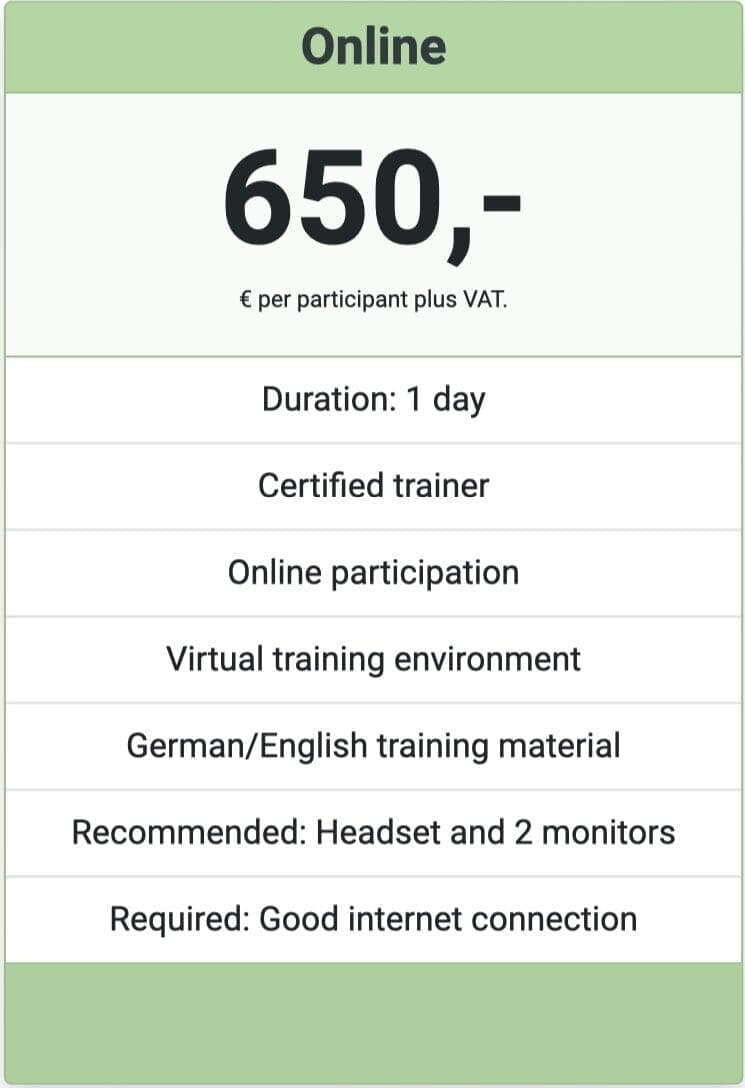
You don't have much time and want to get started with QlikView quickly?
Then this compact quick-start training is exactly what you need. It is highly compressed and does not go into depth like our QlikView Designer training. But you will learn how to create an optimal QlikView UI quickly and easily.
To do this, you load simple sales data from an Excel spreadsheet and then immediately start building a dashboard.
The entire training is very practical and consists of many hands-on exercises to help you quickly create your own dashboards. If you decide that you want to go deeper, you can upgrade to the QlikView Designer training and learn about the more complex topics.
More about Qlik View
More about Qlik View
Fast Track Training
Fast Track Training
What you will learn in Qlik View Training
What you will learn in Qlik View Training
Fast Track
Fast Track

Navigation
In this training, we start with a demo application in which you learn how to navigate easily between the various worksheets.
You will learn how to open a ready-to-use application as an analyst and how to best use the many QlikViewfunctions.

Selections
Using selections, you ask a question and QlikView answers with the green-white-grey principle.
This is the most important basis in analysis and we will discuss it in detail and test it with many small exercises.

Create a new application
In this scenario-based training you are given the challenge to create a sales analysis for a fictitious company. They want to take a closer look at the sales and especially the margins in QlikView.
To do this, you will create a completely new application, which you will then expand into a full analysis over the course of the training. You will learn about the different objects and how to use them in analysis.

Load data
Your new application must first be filled with data, which is the basis for your daily analysis.
You will get to know the QlikView Script Editor and the wizards that help you load the data.

QlikView Desktop
To create a new application you need the QlikViewDesktop. You will get to know it in detail in this training.
You will learn how to use it and how to borrow a licence from QlikView Server.
We will also look at the most important settings in your QlikView Desktop and the difference between the Personal Edition and the Desktop Edition.

Variables
Next, you will learn about the use of variables in QlikView: What they can do, how to create them and how to use them in your analysis.
We will create a what-if analysis and you will learn how to show and hide objects and KPI's with them.
To do this, you will create buttons and use them to show and hide objects.

Best Practices
After your analysis is done, let's talk about a very important point: What are the best practices for QlikView?
You will learn how to best design your QlikViewapplications to ensure optimal speed and what you should pay attention to to avoid unnecessary load on your QlikView server.
Qlik View Training FAQ
Qlik View Training FAQ
General
General
Qlik View Training FAQ
Qlik View Training FAQ
Designer
Designer
Qlik View Training FAQ
Qlik View Training FAQ
Data Architect
Data Architect
Qlik View Training FAQ
Qlik View Training FAQ
Fast Track
Fast Track
We look forward to meeting you!
We look forward to meeting you!
Send us your contact details and we will contact you as soon as possible.
Or schedule a free online meeting with us:
Or call us right now: +49 40 60946300
Quotation and invoicing
Quotation and invoicing
If you need a quote for your company, you can tick it off directly in the contact form - we will send it to you promptly.
Your company can then order the training and pay by invoice. The only important thing is that the invoice is paid by the start of the training.
Other questions
Other questions
We are also happy to answer any questions you may have about the training content.
Maybe you would like a customised training or workshop based on your data?
We are very flexible - feel free to contact us.

